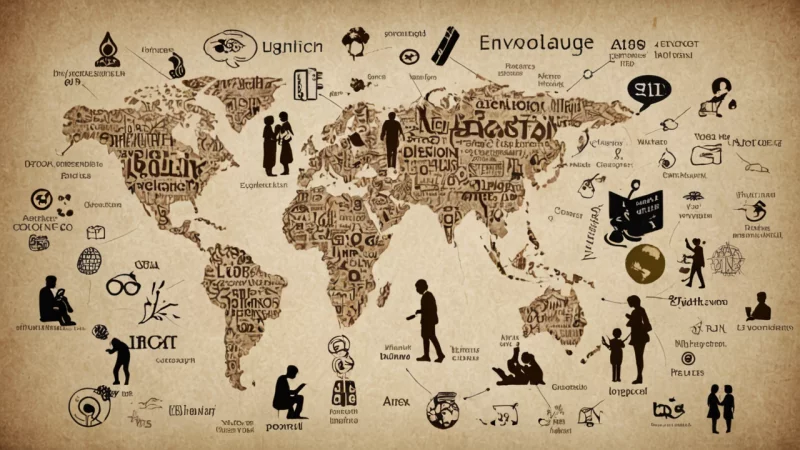
Infographic
Språk: English
Infographic refers to the visual representation of data, often used in computer science and design to communicate information in a clear and aesthetically pleasing way. It can include various types of diagrams, graphs, and other visual elements to present data in a clear and concise manner.
- Infographic refers to the visual representation of data, often used in computer science and design to communicate information in a clear and aesthetically pleasing way. It can include various types of diagrams, graphs, and other visual elements to present data in a clear and concise manner.
Beslektede ord til Infographic
På andre språk
- bildeoversikt Norwegian
- datagraf Norwegian
- datagrafikk Norwegian
- datagrafikkens Norwegian
- dataillustrasjon Norwegian
- faktaramme Norwegian
- infografikk Norwegian
- informasjonsbilde Norwegian
- informasjonsgraf Norwegian
- informasjonsgrafikk Norwegian
- investeringstegning Norwegian
- grafisk design Norwegian
- grafisk fremstilling Norwegian
- statistisk graf Norwegian
- visuell fremstilling Norwegian
- økonomisk tegning Norwegian
Gi tilbakemelding på oppslaget
Hjelp oss å finne feil eller mangler i «Infographic». Velg hva det gjelder og beskriv konkret hva som bør endres. Ikke ta med personopplysninger.